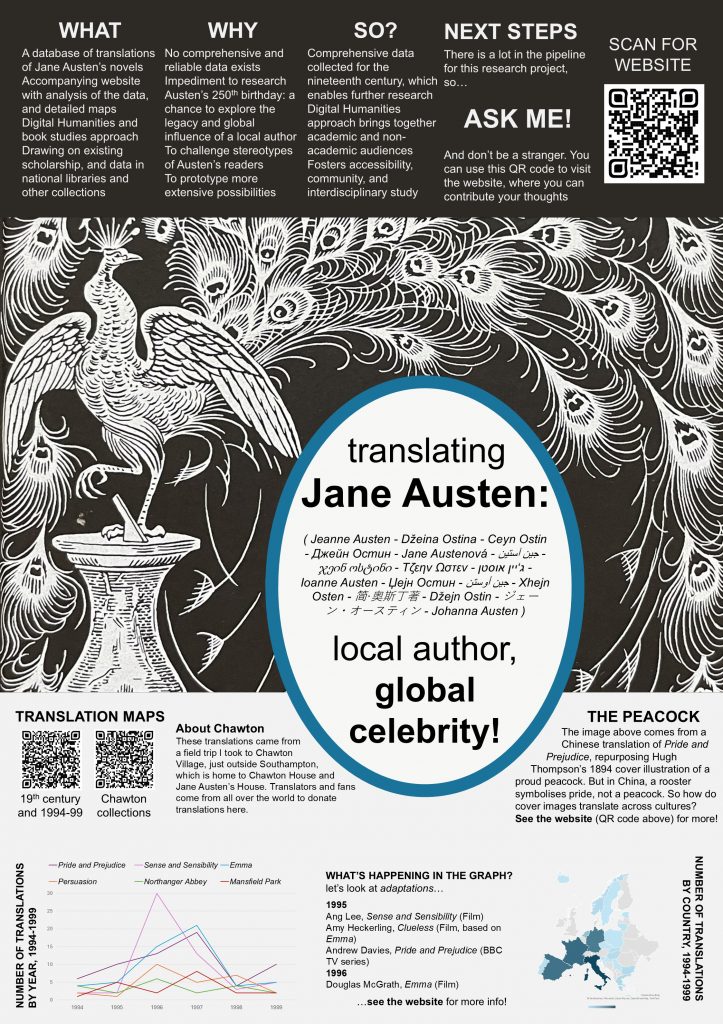
Hello again – I just couldn’t stay away. I am pleased to be able to write that I will be picking up where I left off with the database for my third-year dissertation project, also supervised by Dr Gillian Dow. I’m excited to be able to continue my work, and thrilled to be making a contribution to the field of Austen studies. Austen’s 250th birthday now behind us, we must look ahead – where do we want Austen studies, and in particular Austen translation studies, to go in the future? What new issues will be thrown in our path? What new readers will discover her, and how will she be discovered?
What will the dissertation entail?
It was always a shame to me that I didn’t get to include some more obscure languages in the database, as they weren’t yet published by 1999. For example, a Cornish translation of Pride and Prejudice, Gooth ha Gowvreus, by Nicholas Williams, was published in 2015.
In my dissertation, I will be adding a new section to the database that reflects a more up-to-date look at the range of Austen translations available today. For this reason, I have chosen to focus on the year 2017 – the bicentenary of Austen’s death. My hope is that this year will show an increase in new and reissues of translations, reflecting a renewed attention to Austen in the year of her death.
This new section will complement the previous sections from the nineteenth century and from 1994-99. My dissertation will aim to review the history of Austen in translation, using large scale quantitative analysis of the database to explore patterns, trends, and disruptions to this history.
Simultaneously, I will conduct an analysis of how translation studies can be best approached. I am conscious of the shortcomings of the database, which can only contain so much information, due not least to the patchy records I am working from. Hence I aim to conduct interviews with translators to gain a qualitative insight into specific case studies from around the world. This dual approach will allow me to explore both what has changed in the last 200+ years of translation, as well as how we can learn to study translation better, by paying more attention to both global trends and specific points of interest.
The scope of this project is vast, but my goal is not to provide conclusive answers. Rather, it is to tentatively – and curiously – approach questions such as: how can we better conduct translation studies? How can digital humanities tools aid translation scholars, and what are their weaknesses? Where is the future of Austen in translation headed? And how might we interact with and plan for that future?
Whilst working on the internship this summer, and again at the Arts and Humanities day in November, where we ran an arts and crafts session based on the project, I became deeply interested in studying material book history. Understanding how books travel across the world and how they arrive in the hands of their readers has become a point of continual fascination for me.
I can’t wait to start work on this project again. As my dissertation develops, I will provide regular updates on the state of the database, and any additional resources I add.
I’m looking forward to finding out all I can about the global Jane Austen!
